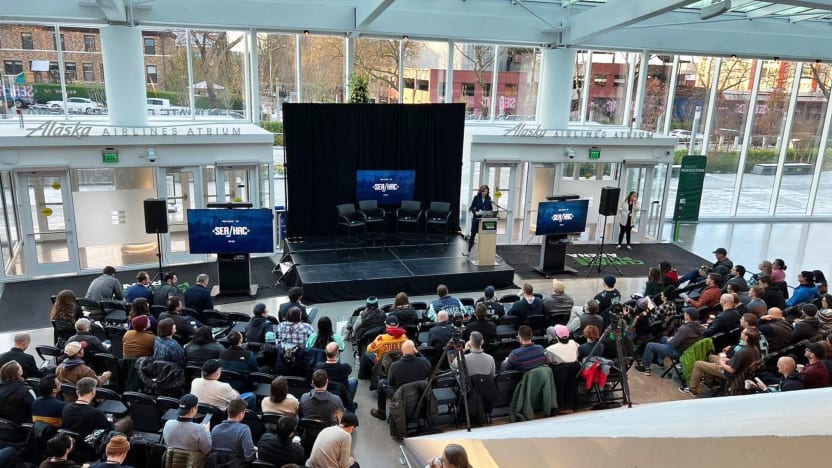
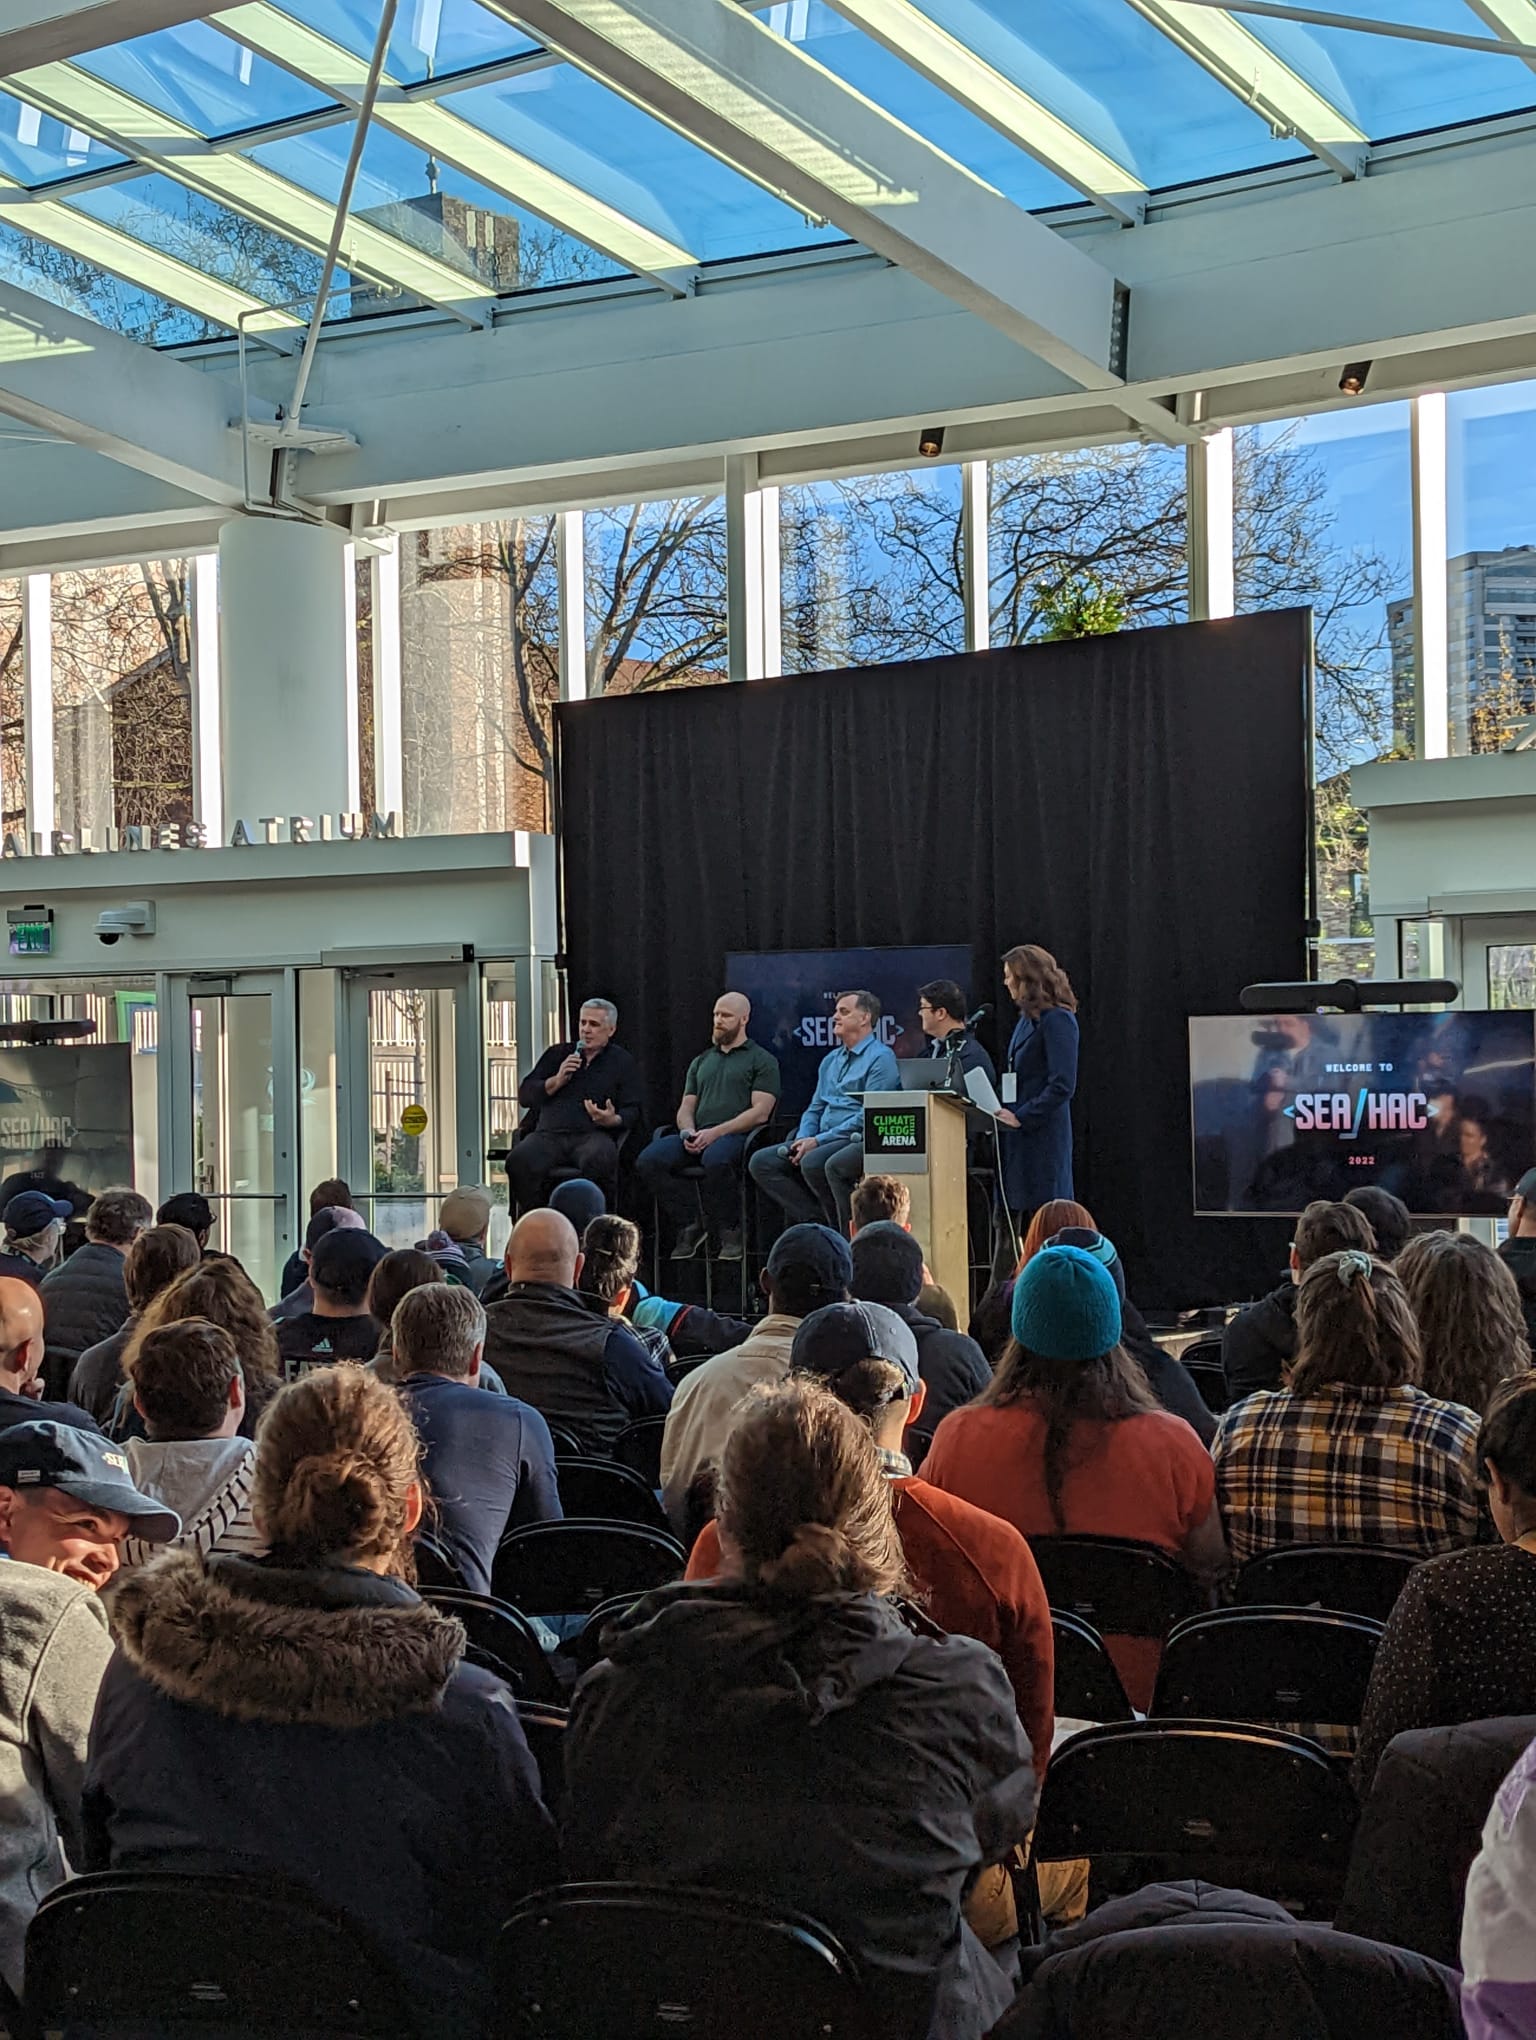
On December 3, 2022, the Seattle Kraken hosted SeaHac - their Seattle Hockey Analytics Conference hosted at Climate Pledge Arena. A sold-out room of ~250 people, more than three dozen presenters, and input from the Kraken’s hockey ops plus nine other NHL teams.
And then there was us: a couple of hobbyists who met in an online data community, stepping up for the lightning round to talk about NHL data. The title on record was “Built different 😤 - modernizing public NHL data.”
Ron Francis was in that room - Hall of Famer, and the Kraken’s GM at the time. I buy and sell his hockey cards. Probably nothing to him, but an actual hobby of mine since I was a kid. And there I was a few feet away, about to get up and talk about data science and engineering pipelines…
“…do you guys have day jobs?”
The project came out of the-data-base - in my own words, “where data people go to banter, share & do stuff.” A place to learn, post “dank memes”, and occasionally do real work. It started with two of us: me on the data science side and Gavin He on data engineering.
People kept asking some version of “…do you guys have day jobs? Why are you doing this?” And the honest answer was: “Well yea, we just like learning stuff.” That was the whole thing. No product, no company - just curiosity.
Our unofficial tagline, long before it made it to a stage.
What we actually showed
The premise was simple, if a little cheeky: the public NHL Stats API sucks to work with. It’s raw, awkwardly structured, and genuinely hard to do data science on. So we asked - what if we held hockey data to the same standard a serious tech or retail org holds its data?
So we built the whole modern data stack on top of it:
- Extract - a Singer tap (
tap-nhl) on Meltano, pulling 10+ NHL endpoints, orchestrated with GitHub Actions, - Load - into Google BigQuery,
- Transform - dbt (with sqlfluff keeping the SQL honest), turning raw feeds into documented, tested, dimensional models,
- Then the science - expected goals and breakout models on top of the clean data.

Two details the practitioners in the room appreciated: we let dbt auto-generate the docs - column descriptions, lineage, dependencies - and the payoff was that you could just SELECT play-level events with an xg_proba column straight out of the warehouse, like it’s any normal analytics table. Guiding principle: data first, science after. Better data, better models.
The (very humble) flex
On top of all that clean data, we built an expected-goals model. And - it’s NOT a competition - but our xG model stacked up respectably against a well-known public one. Was that good? Honestly, we were still figuring that out ourselves. The point was never the leaderboard; it was that a couple of people learning in public could get there at all. (If you want the numbers and the calibration work, that’s in the xG deep-dive: 2026 refresh.)
What it meant
The thing I keep coming back to is the contrast: a self-organized group that formed around memes and curiosity got a real NHL stage, streamed online, in front of people who do this for a living. Nobody paid us to build it. We built it because it was fun, and the hockey-analytics community was generous enough to make room for that.
That’s stuck with me more than any metric.
Come build with us
the-data-base is open - come banter, share dank memes, or do some real work with us. If you want the technical story, the public NHL data modeling write-up is the origin (it’s since been rebuilt into datarena).
And if any of it resonates, I’d love to connect.